
Project Description
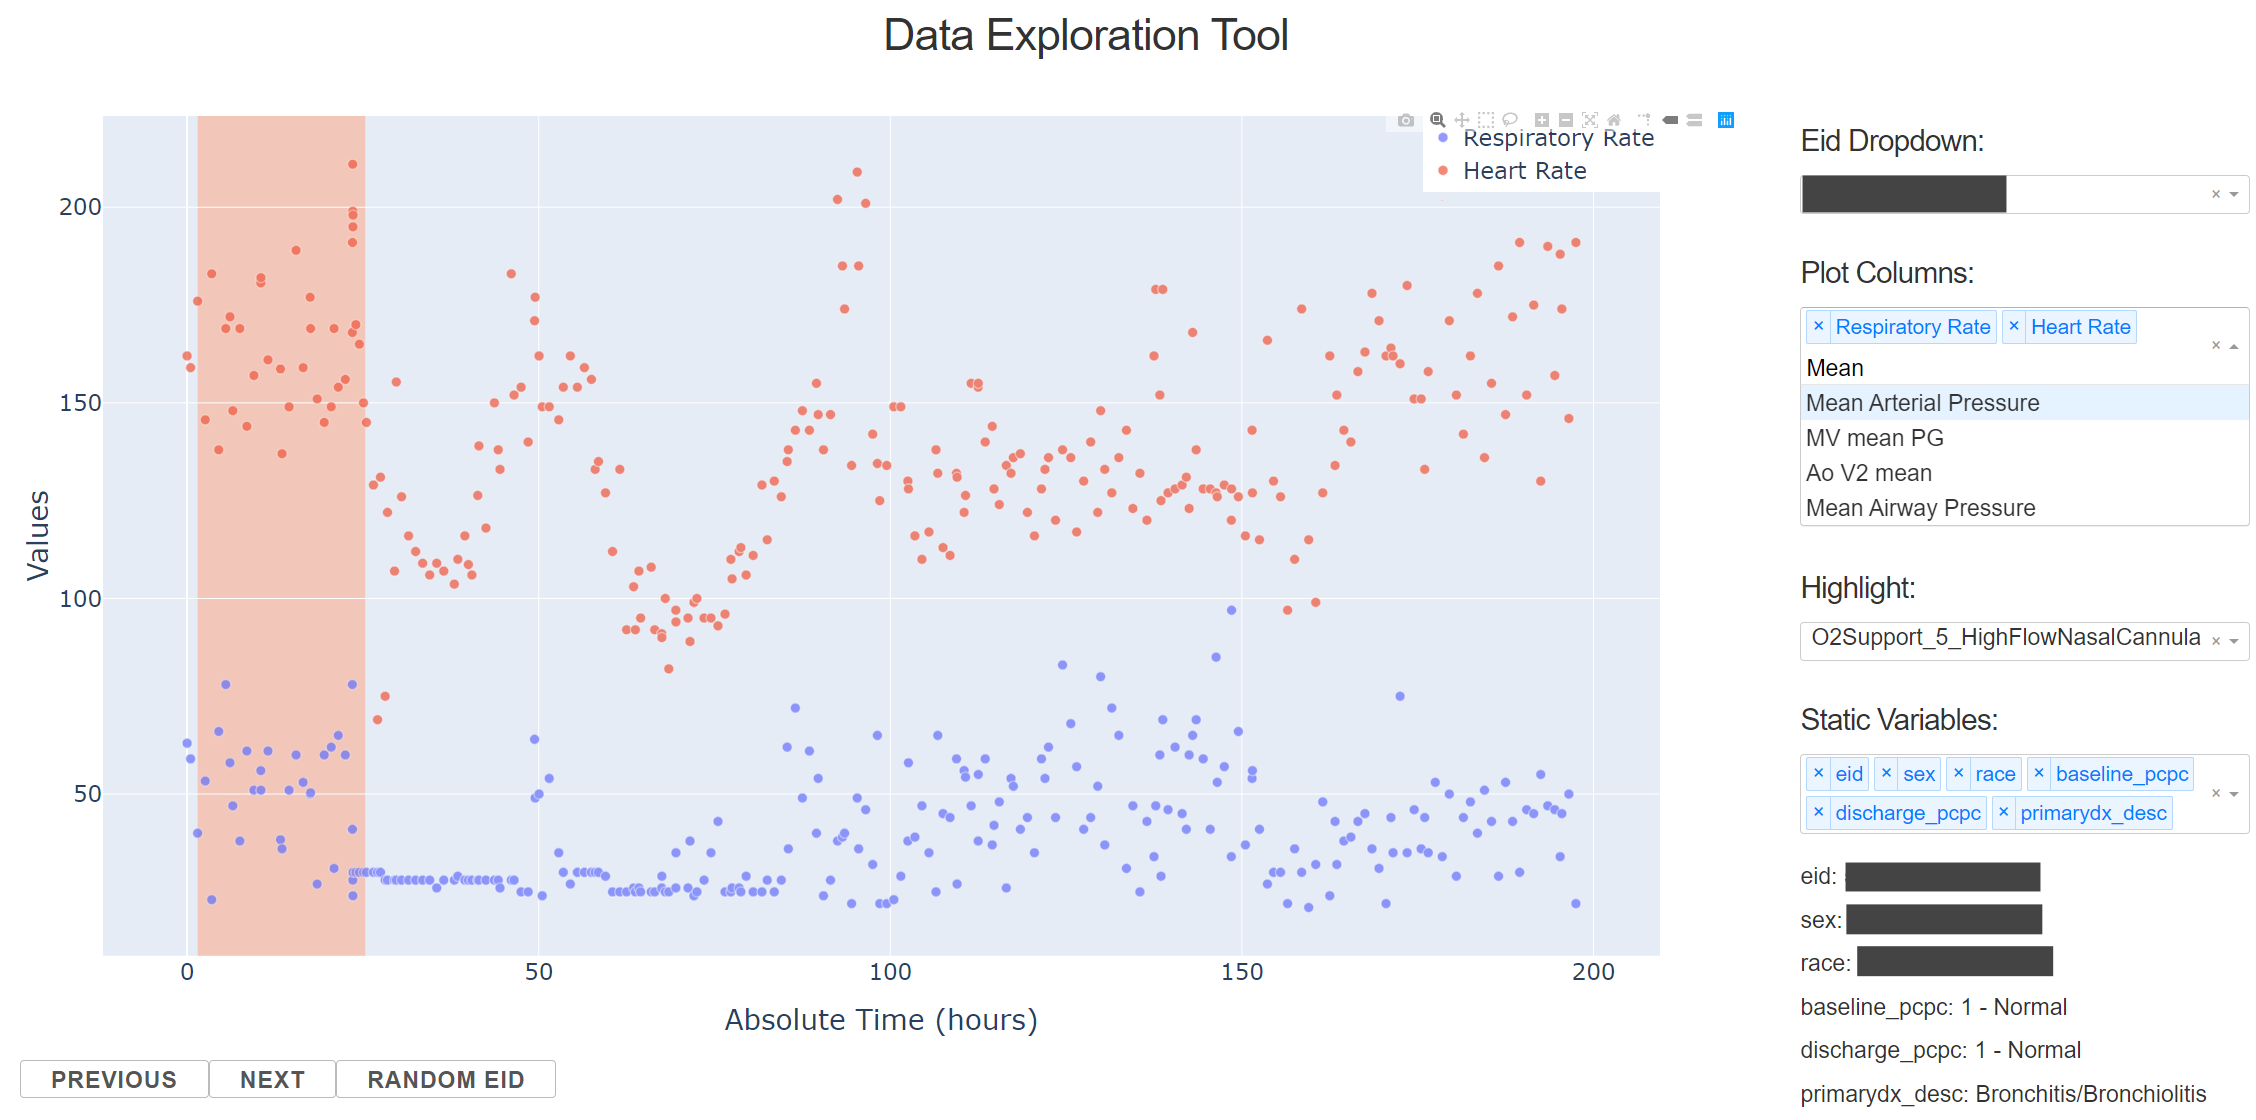
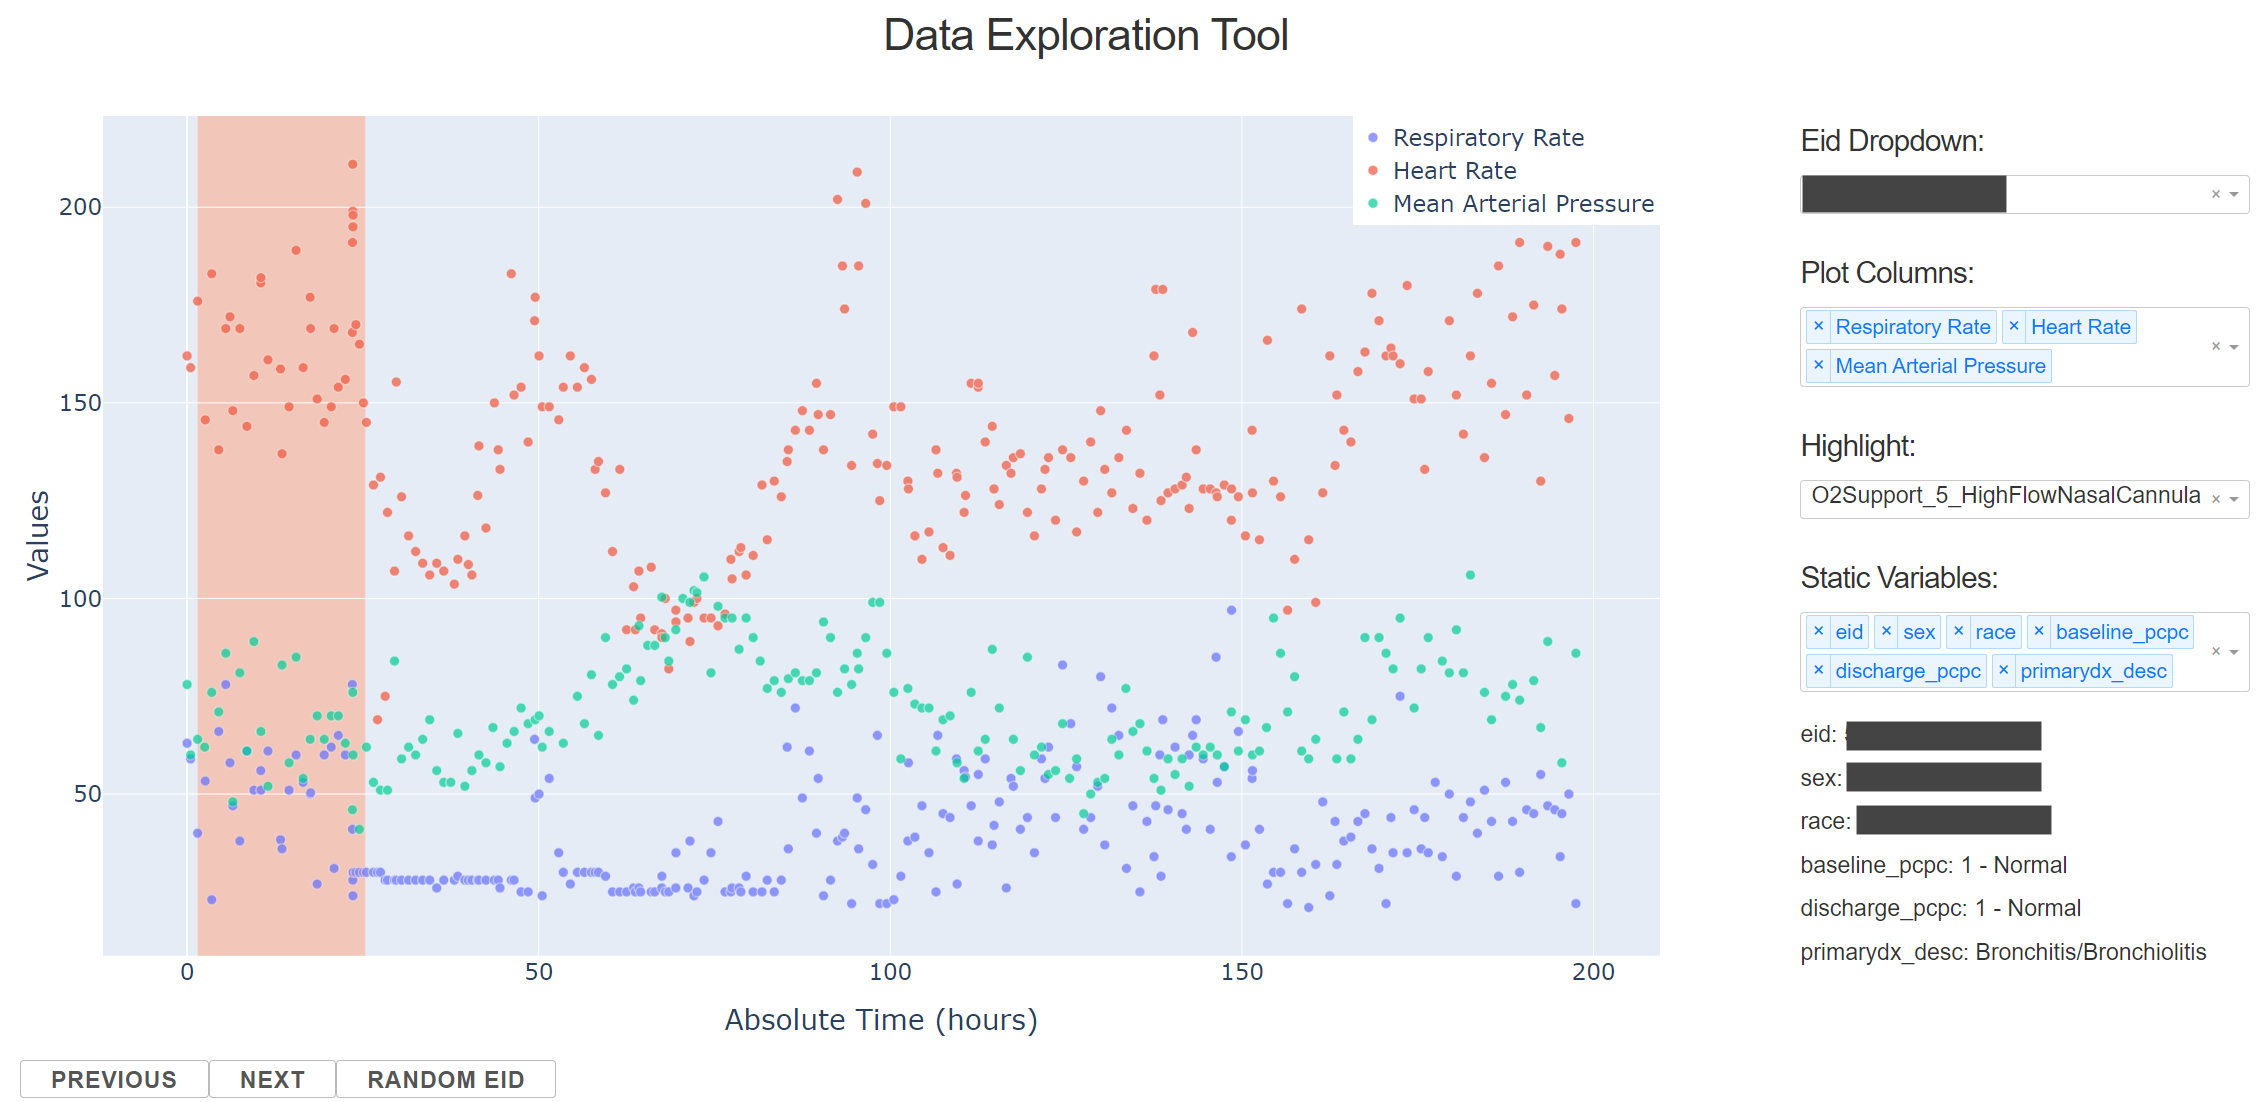
I developed a web application using Dash by Plotly (Python) to help data scientists explore ICU patient data. Each dataset comprised of thousands of ICU patients, hundreds of variables, and time series data starting from patient admission to the ICU to time of discharge. Users were able to dynamically graph and highlight their selected variables of choice.
This versatile web application was used, reiterated, and repurposed for many different data science projects.